Official political or organizational boundaries—such as countries, states, and counties—used to structure, analyze, and display spatial data.
Administrative Units
This guide helps you:
- Identify and describe administrative units commonly used in GIS mapping and spatial analysis.
- Evaluate and validate GIS join outputs using established data management and quality assurance practices.
Administrative units may include political boundaries as well as areas or districts that are used in the everyday work of government agencies or utilities. Examples include Census tracts, water districts or school districts, neighborhoods of a city defined by the city government, service areas, etc. Place names such as bodies of water (e.g. Lake Superior) or National Parks have designated boundaries that can be mapped. Maps of these boundaries may not be easy to find, but the data associated with administrative units and place names may be critical for understanding a spatial problem.
Depending on the GIS platform you select, there could be more than one method to map your data. Some common approaches include table joins and spatial joins. Both of these methods result in maps that represent administrative units as areas.
Which approach should I choose?
Use a table join if you:
- Have admin units that aren’t able to be geocoded using a standard geocoder. Select a table join if you are working with census units, election districts, school boundaries, National Park boundaries, or any other non-standard national or subnational geometries
- Pick a desktop platform that requires more effort to perform geocoding and you don’t want to bother with all that.
Use a spatial join if you:
- Are working with country, state, province, or county-based data and you don’t want to download a geometry layer to do a table join.
- Pick a platform that readily supports geocoding (web-based tools generally have more straightforward geocoding interfaces, they typically recognize geographic fields).
Recommended practices:
- Try to choose a tool that will create a new file. If the tool you choose creates a temporary join, make sure you save your joined data as a new file.
- Some tools will allow you to select the fields you want to add to the new file so that only those are added. You can also delete un-needed fields from the files either before or after the join. Remember: There are some fields that GIS programs require, like the ObjectID field. Don’t delete these!
Method 1: Table Join
A table join copies data from one table to another based on a key field that is the same in both tables. Through this process you can create a new geospatial file that enables you to map data stored in a csv or spreadsheet.
Requirements:
- The table that contains your data includes a column with an administrative unit (called the key field).
- Geospatial file containing the geometry for the admin unit AND a column for the administrative unit formatted identically to the data table (the key field).
General Process:
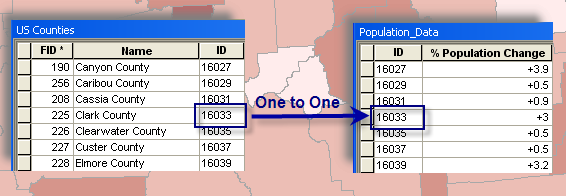
- Step 1: Load both of your files into your GIS platform.
- Run the Table Join tool in order to create a new file that adds the data from your data table to the geometries of the other.
Note: The direction of the table join matters (target vs. source --use the language for each program).
Things to watch out for when joining tables:
You may need to clean your data to ensure that your data will join as expected.
- Make sure that your geometry file field name values match that of your field name values in your data table key field. Don’t spell out names in one key field and have the other key field contain abbreviations, they won’t join. (e.g. California and CA)
- Watch out for numbers stored as text, (Tip, if you add an ‘ before a number, it will convert it to text. This is great if you are trying to add a leading zero.)
- These can be tricky! Trailing or leading zeros and spaces, dashes, underscores, capitalization can all make the values appear different to a computer. Examples:
- “ citrus-land” vs. “citrus-land” (leading space)
- “Apple-tree” vs. “Apple_tree“ (dash vs. underscore)
- “Almond_Tree” vs. “Almond_tree” (capitalization must match)
- “06520” vs. “6520” (5-digit zip codes must have 5 digits, and leading zeros may disappear if stored as numbers)
Method 2: Map your data as points and then do a spatial join
Why one might choose a spatial join over a table join is in a spatial join, you don’t have to worry about the formatting of your key fields. However, this works best in situations where you have a platform that easily supports geocoding. While almost all platforms support geocoding, some require more steps than others. Web-based platforms typically recognize your data to assist in quickly geocoding.
Requirements:
- The table that contains your data includes a column with an administrative unit.
- The administrative unit must be included in a standard address geocoder (e.g. country, state, province, county) and NOT something like census geometries, school districts, park boundaries, election districts, etc.
- A boundary file (or platform containing a boundary file) that includes the geometries for the areas you want to map.
General Process:
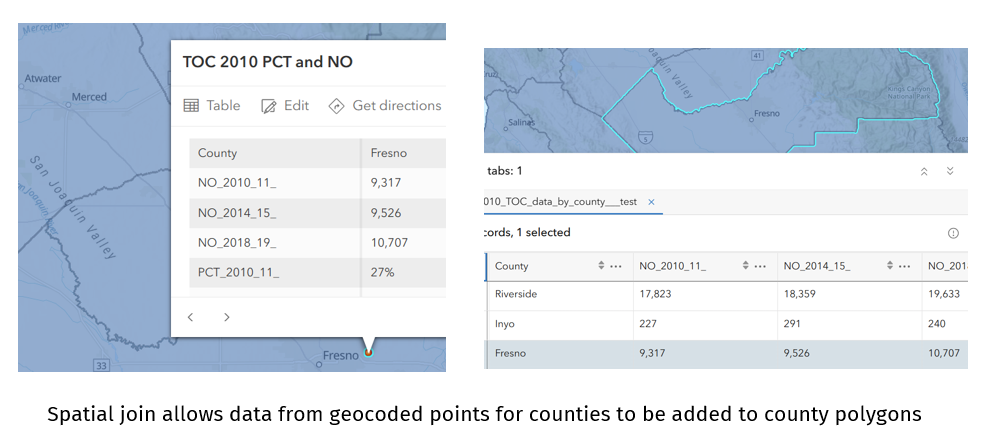
- Step 1: Geocode your data so that it is represented as points. In a web-based platform this is usually a straightforward process that happens as part of uploading data. See the section on geocoding for more details.
- Step 2: Run a spatial join in order to match the points to the overlapping areas based on their spatial relationship. Create a new file that associates the data you want to map with the administrative areas (represented now as areas not points).
Wrapping up: Double check your data :)
- Does your data line up where it should be?
- Make sure you have the expected number of results mapped.
Tool-specific Documentation Links
QGIS
- Joining features between layers (QGIS Documentation)
- Tool-based documentation
- Performing Table Joins
- A short tutorial that walks you through obtaining a population data table and a boundary file from the US Census website, uploading them into QGIS, and creating a new joined file using a Table Join. Also includes steps to create a population density map for California from this new file.
ArcGIS Pro
- Add Join (Data Management)
- Tool-based documentation
- Join tabular data to a spatial layer
- A 15 minute tutorial that has you join a CSV of data to a layer in ArcGIS Pro
ArcGIS Online
- Join Features
- Tool-based documentation
- Join a table to a feature layer in ArcGIS Online
- A 15 minute tutorial that has you join data from a CSV to an existing layer in ArcGIS Online
Need Help?
If you have questions or need assistance, please contact us!