Choose the map that best tells your story
What kind of map do you want to create?
Maps are powerful and there are many types of maps you can create. When getting started with a mapping project using GIS, it’s helpful to think at the beginning about what you want your map to look like. Read through the descriptions below to help answer this question.
There are many kinds of maps!
Here are some broad general categories (non-exhaustive) to get you started thinking:
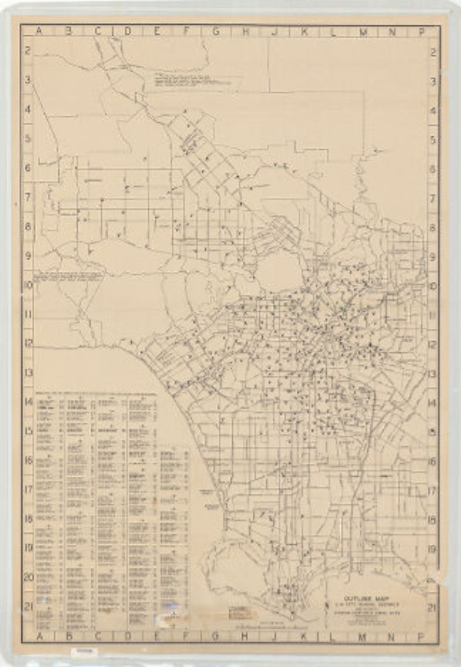
Location & reference maps
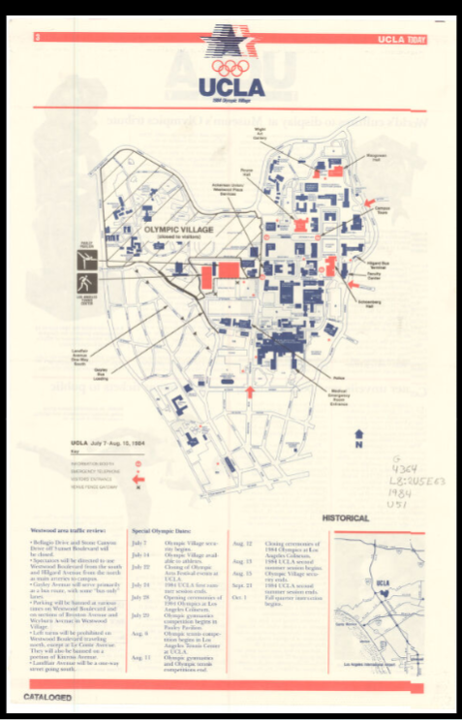
This type of map shows where things are located. You can also include some information about that location.
Examples:
- A map showing the location of elementary schools in San Francisco, color-coded by whether they are public, charter, secular private, or religious.
- The boundaries of field plots for an ecological survey.
- Transit and station maps show public transport routes and specific train or bus stops.
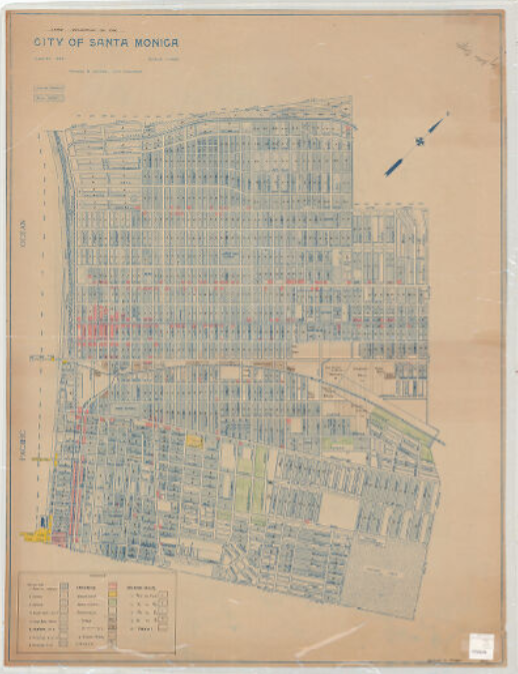
- Site and property plans to show exact land boundaries.
Thematic maps
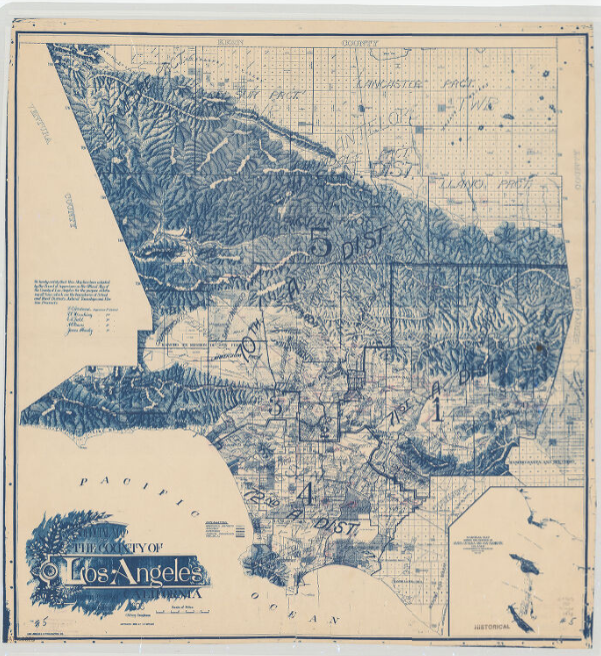
With a thematic map you can show how something changes over an area. Choropleth maps are a kind of thematic map that maps quantitative data.
Examples:
- The percentage of farmland in each county in California’s Central Valley that was planted in almonds last year.
- Dot density which uses dots to show where a specific item or group is concentrated. Ex: Where one dot equals 500 residents to show rural versus urban distribution.
- Weather map showing equal lines of barometric pressure or temperature ranges.
- Election maps: looking by county by county or state by state.
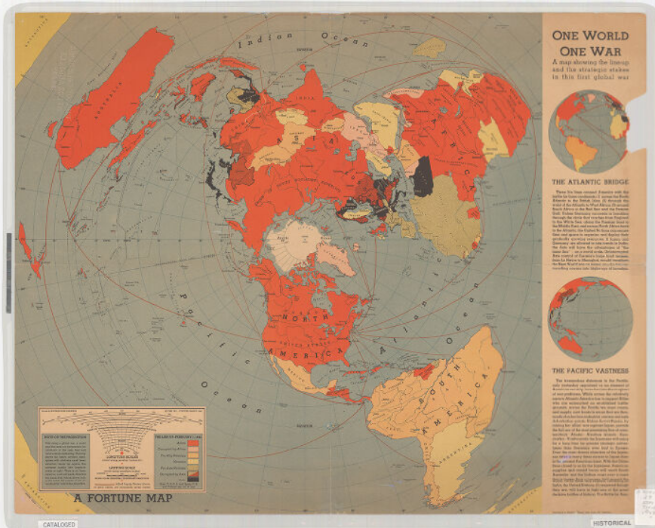
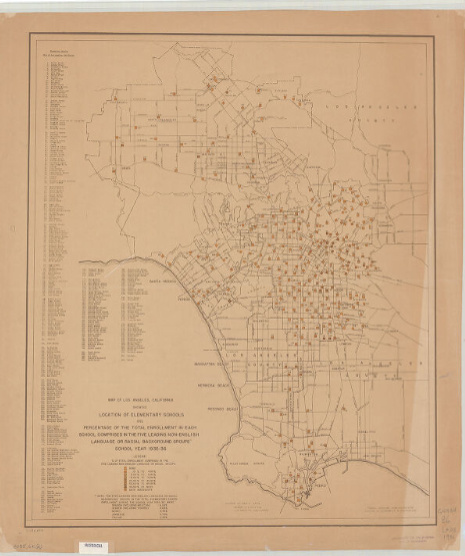
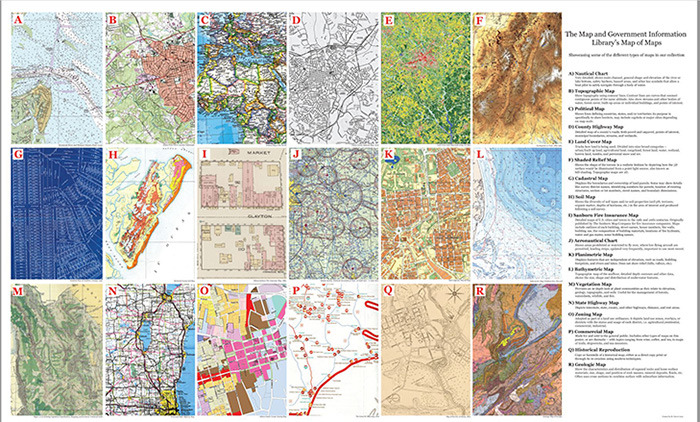
We gave you some examples of different types of maps, to see and learn more about different types of maps, look at the Map and Government Information Library’s Map of Maps/Map Types
Great! Now that you have an idea of what kind of map you want to make, let’s continue!
Need Help?
If you have questions or need assistance, please contact us!